Businesses generate large amounts of data every day. Sales, inventory, purchasing, finance, customer activity, and other operations all produce information that managers need to monitor.
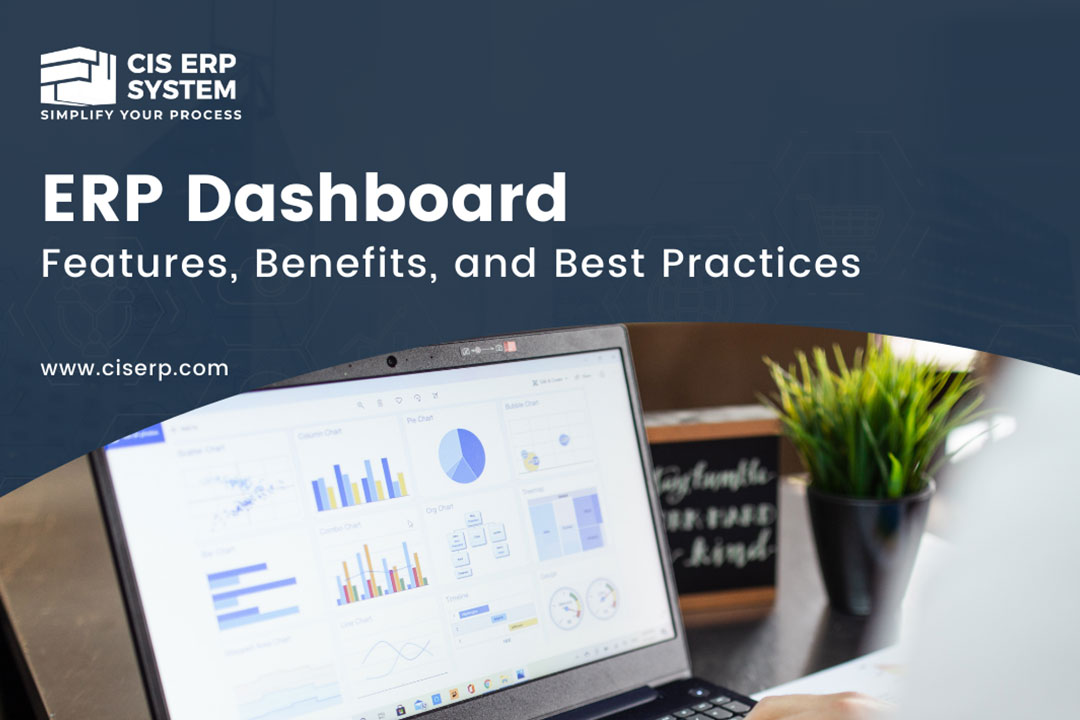
An ERP dashboard brings important business data into a visual workspace. Instead of going through multiple reports or screens, users can view relevant KPIs, trends, alerts, and operational information in one place.
A well-designed dashboard does more than display numbers. It helps teams understand what is happening, identify issues, and decide where action is needed.
What Is an ERP Dashboard?
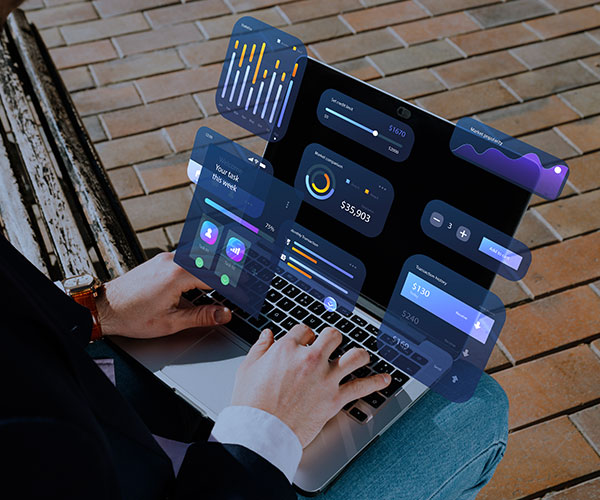
An ERP dashboard is a visual interface within an ERP system that displays selected business information through KPIs, charts, tables, reports, and other indicators.
The information shown depends on the user’s role and business requirements. For example, a sales manager may need to monitor revenue, orders, and sales targets, while a warehouse manager may focus on stock levels, pending orders, and inventory movement.
Modern ERP platforms commonly support role-based dashboards, KPI tracking, reporting, and business intelligence so users can work with information relevant to their responsibilities.
Key Features of an ERP Dashboard
KPI Monitoring
Key performance indicators help businesses measure progress against specific goals. Common ERP KPIs include sales revenue, gross margin, inventory turnover, outstanding receivables, order volume, and fulfilment performance.
The important point is to select KPIs that support actual business decisions rather than filling the dashboard with every available metric.
Visual Reports and Charts
Dashboards can turn large amounts of data into graphs, tables, KPI cards, and other visual formats. This makes it easier to identify trends and compare performance over time.
For example, a sales chart can show whether revenue is increasing, while an inventory report can highlight products approaching their reorder levels.
Role-Based Views
Different employees do not need access to the same information. An ERP dashboard can be configured according to user roles so that employees see the information relevant to their responsibilities.
A finance manager may need financial reports, while a warehouse supervisor may need inventory and fulfilment data. Role-based access also helps limit exposure to sensitive information.
Real-Time or Frequently Updated Information
Some ERP dashboards can provide real-time information, while others depend on scheduled data refreshes or the underlying reporting architecture.
This distinction matters. A dashboard should clearly indicate how current its data is, particularly when managers use it for inventory, cash flow, sales, or operational decisions.
Drill-Down Reporting
A useful dashboard should not only show that something has changed. Users should be able to investigate the underlying information where the system supports drill-down functionality.
For example, if monthly sales fall below target, a manager may need to move from the overall KPI to individual products, sales orders, customers, or regions to understand the cause.
Alerts and Exceptions
Dashboards can also bring attention to situations that require action, such as low inventory, overdue invoices, delayed orders, or unusual changes in performance.
This shifts the dashboard from being a passive reporting screen to a tool for monitoring business activity.

Benefits of Using an ERP Dashboard
Faster Access to Business Information
Employees spend less time searching through separate reports when important information is available in a central dashboard.
Better Decision-Making
Managers can compare current performance with targets, historical results, or other relevant benchmarks. This gives them a stronger basis for deciding where to allocate resources or investigate problems.
Improved Visibility Across Departments
An ERP connects information from different business functions. A dashboard can bring selected information from sales, finance, purchasing, inventory, and operations together, helping managers understand how one area affects another.
Less Manual Reporting
When reports and KPIs are generated from ERP data, employees may not need to repeatedly compile information from spreadsheets and separate systems.
Faster Identification of Problems
A sudden drop in sales, low stock levels, rising outstanding payments, or delayed orders can become visible sooner when the relevant metric is actively monitored.
How ERP Dashboards Are Used in Different Departments
The most useful dashboard depends on what a department needs to monitor.
Sales: Revenue, orders, sales targets, customer activity, and product performance.
Finance: Receivables, payables, cash flow, expenses, revenue, and profitability.
Inventory: Stock levels, reorder requirements, inventory movement, and slow-moving products.
Purchasing: Purchase orders, supplier performance, pending deliveries, and purchasing costs.
Management: High-level KPIs, profitability, sales performance, operational trends, and other metrics linked to strategic goals.
ERP Dashboard Best Practices
-
Start With Business Goals
Before designing a dashboard, identify the decisions it needs to support. Ask what managers and employees need to know regularly and which problems they need to detect.
This prevents the dashboard from becoming a collection of unnecessary charts.
-
Choose the Right KPIs
Focus on metrics that connect directly to business objectives. A sales team may need conversion and revenue data, while a warehouse team may need stock availability and fulfilment metrics.
KPIs should also have a clear monitoring schedule and an understanding of what action should follow when performance changes.
-
Keep the Layout Simple
Too many widgets can make important information difficult to find. Place the most important KPIs where users can see them quickly and group related information logically.
-
Match Dashboards to User Roles
A single dashboard does not need to serve everyone. Create role-specific views where appropriate so employees can focus on information relevant to their work.
-
Make Data Quality a Priority
A visually attractive dashboard cannot compensate for incorrect or incomplete data. Businesses should establish clear data ownership, consistent processes, and appropriate validation so that dashboard information remains reliable.
-
Protect Sensitive Information
Use appropriate user permissions and access controls to ensure employees only see information they are authorised to access. Dashboard access should be considered alongside access to the underlying business data.
-
Review and Improve the Dashboard
Business priorities change. Review dashboard usage and remove metrics that no longer provide value. New KPIs or reports may need to be added as the business grows.
Why Customization Matters
Different businesses have different workflows, KPIs, and reporting requirements. A retail company may prioritise inventory and sales, while a service business may focus more on projects, billing, and resource utilisation.
Modern ERP analytics can provide prebuilt dashboards and KPIs while also allowing businesses to create or customise reports based on their requirements.
The goal is not to build the most complicated dashboard. It is to create a workspace that gives each user the information they need to understand performance and take the next step.
How Can CISERP Help?
CISERP brings business data and processes into an integrated ERP environment, helping businesses manage and monitor their operations through connected information.
With the right dashboard setup, teams can focus on the KPIs and reports that matter to their roles instead of relying on scattered spreadsheets and disconnected data.
Explore CISERP to see how an ERP system can help your business manage information, improve visibility, and make day-to-day decisions with greater clarity.
FAQs
Q1: What is an ERP dashboard?
A: An ERP dashboard is a visual interface that displays important business information from an ERP system. It can include KPIs, charts, reports, alerts, and operational data relevant to a user’s role.
Q2: What should an ERP dashboard include?
A: An ERP dashboard should include the KPIs and information users need to make decisions. Depending on the role, this can include sales, inventory, finance, purchasing, orders, receivables, profitability, or operational metrics.
Q3: Are ERP dashboards real-time?
A: Some ERP dashboards provide real-time information, while others use scheduled data refreshes. The frequency depends on the ERP system, reporting tools, integrations, and underlying data architecture.
Q4: How do ERP dashboards improve decision-making?
A: They bring relevant information into a visual format, making it easier to monitor performance, identify changes, investigate problems, and compare results with business targets.
Q5: Can different employees have different ERP dashboards?
A: Yes. Many ERP platforms support role-based dashboards, allowing users to view information relevant to their responsibilities while restricting access to sensitive data.